Exploring beneath the surface of soil-based sports fields down under
Exploring beneath the surface of soil-based sports fields down under
By Dr Richard Gibbs
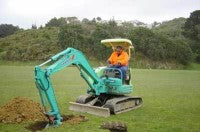
Figure 1a. The fastest and most informative way to determine soil profile properties - great for sites that are about to undergo major redevelopment.
Introduction:
Since the mid-1990s there has been a requirement for local authorities in New Zealand to implement 'asset management plans' and 'customer-agreed' service levels, a move reinforced by the expectations of the Local Government Act 2002. In simple terms, an asset management plan requires a local authority to identify their assets, measure their condition on a regular basis and assess their value. In addition to various pieces of infrastructure managed by local authorities, these plans are also required 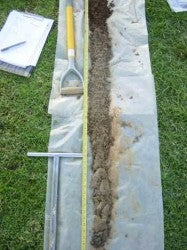
The purpose of this article is to illustrate how a simple assessment of basic soil and construction characteristics of a sports field can be used to 'capture' its condition and lead towards a better understanding and planning of overall sports field performance.
Figure 1b. A soil profile reconstituted with the use of a soil auger - good for sites where the surface cannot be disturbed because of existing play.
Sports field condition capture:
The principal requirement for a simple assessment system is that it can be implemented by turf managers, for turf managers. Therefore the system should be able to produce data that can be used to actively manage and improve fields. Do such assessment systems already exist? Certainly there is no shortage of measurement techniques. However, the difficulty with this whole subject area is that many published methods require specialist measuring equipment that is often simply not available or is too time consuming to use or is too expensive to hire along with an operator. In many cases what is lacking (in New Zealand at least) is the ability to assess sports field quality at the school, club and community end of the market - in other words, a really simple but robust method of assessing sports fields for quality without a) the need for complicated and expensive pieces of measuring equipment, b) without being too time consuming and c) without being too subjective.
For the last 18 months Sports Surface Design & Management (a consultancy division of Auckland-based Recreational Services Ltd) has been working with various local authorities in the greater Auckland region and the NZ Sports Field Forum (the nearest organisation we have to the IOG) to design a simple but effective self assessment sports field quality scoring system. Readers in the UK may be interested to know that the origins of this system go back to the 1980s when the author was working in the UK on Sports Council funded projects.
Categorise each field according to soil and construction characteristics:
The precursor of any self assessment system (and what this article is about) must be knowledge of the basic soil and construction characteristics of individual fields. Without this knowledge, it is virtually impossible to formulate any accurate expectation of a field's performance in terms of sustainable usage. This is because sports field performance is highly dependent on location, how it was built and the type of soil it was built out of, plus the local weather, surface conditions and type of use (e.g. senior vs. junior, training vs. match play) each time it is used.
|
|
|
|
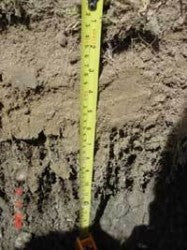
Figure 2a. Grade 1 or 2 type soil profile (e.g. undisturbed site with significantly more than 150 mm stone-free topsoil; free-draining gravely subsoil). |
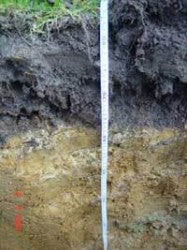
Figure 2b. Grade 3 type soil profile (e.g. good topsoil depth [more than 150 mm] and physical condition, but cut-and-fill site; slightly imperfectly drained subsoil). |
Therefore, the starting point should be to categorise each field as to its inherent soil and construction quality. Such characteristics generally need to be assessed only once, as they are unlikely to change unless a field is renewed or upgraded. However, they are critically important in helping to understand why a field performs in a certain way. This exercise will also identify those soil-based fields worthy of a potential drainage upgrade and will most likely identify those fields for which further upgrading is simply not economically worthwhile. Although some effort is required for this stage, this is a one-off exercise and the information required is not necessarily complex.
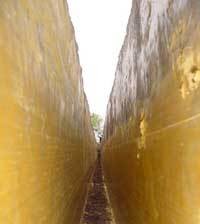
Figure 1c. If any form of trenching is about to take place on a sports field (e.g. for cable or pipe laying or irrigation installation), get out there and make a note of the profile characteristics - what better way to see the profile with someone else doing the excavation!
For example, it would be unrealistic to expect a sports field to sustain high levels of use and retain a good cover of turfgrass during winter if the soil profile was made up of poorly drained clay over a landfill site and there was significant run-off problem from adjacent hard surfaces onto the sports field - such characteristics would result in a poor soil and construction quality grading. Under these circumstances, it would be sensible to use the sports field only when weather and ground conditions permitted and even then it would often be unrealistic to expect the quality of the surface and associated play to ever be above 'average'.
Table 1 lists the three main soil and construction characteristics assessed and their associated sub-characteristics for capturing the condition of a soil-based sports field. For each sub-characteristic there are three descriptors of quality, with each descriptor having a certain points value. For example, the three descriptors for the sub-characteristic of 'method of construction' (part of the 'upgrading/renewal potential' main characteristic) are as follows:
1. Field built on undisturbed, natural soil profile: maximum points scored
2. Field built using cut-and-fill construction: intermediate points scored
3. Field built on reclaimed land, landfill or tip site: zero points scored
TABLE 1: Summary of assessed characteristics contributing to soil-based sports field construction quality
|
Main characteristic |
||
|
Inherent profile properties |
Upgrading/renewal potential |
Surface levels and surrounds |
|
Sub-characteristic* |
||
|
Topsoil texture |
Method of construction |
Extent of settlement |
|
Topsoil structure |
Average depth of topsoil |
Degree of slope/grade |
|
Soil smell and colour |
Type of drainage system installed |
Extent of isolation from run-off |
|
Subsoil condition |
Type of irrigation system installed |
Presence of hard surfaces |
|
- |
Ease of trenching |
- |
* each sub-characteristic is further described by three descriptors of quality linked to a points scoring system.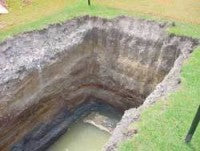
Table 2 illustrates the relationship between typical descriptors of quality and the overall 5-point soil and construction quality grading scale.
Fields categorised as 'below average quality' (Grade 4) or 'low quality' (Grade 5) require special consideration. This is because these fields will need a substantial feasibility study to determine whether further upgrading can be economically justified. Such a study may need to include bore logs, load bearing strength tests to determine settlement potential, as well as a review of the quality and intensity of usage demand. It is likely that many fields in these categories (particularly Grade 5) should be discounted for any serious future upgrading and earmarked for low grade/recreational play only.
Figure 2c. Grade 4 or 5 type soil profile (e.g. reclaimed site, poor topsoil condition, clear signs of poor drainage conditions in subsoil; organic layer at depth that could lead to future settlement).
Table 2:Illustration of the relationship between soil and construction descriptors and quality grading for soil-based sports fields.
|
Grading |
Typical characteristics contributing to grading |
|
Grade 1 High quality |
Undisturbed natural profile; significantly more than 150 mm average topsoil depth; likely to be stone-free; lateral pipe drainage system likely to be installed unless profile naturally free-draining; no signs of poor drainage or poor structure in profile; surface has good natural fall or has been regraded, with no settlement visible and no potential for extraneous water to be discharged onto the surface; existing automatic pop-up irrigation system installed. |
|
Grade 2 Above-average quality |
Undisturbed natural profile; no less than 150 mm average topsoil depth; likely to be relatively stone-free; lateral pipe drainage system likely to be installed unless profile naturally free-draining; minimal signs of poor drainage or poor structure in profile; surface has good natural fall or has been regraded, with no settlement visible and minimal potential for extraneous water to be discharged onto the surface; likely to have some form of irrigation system installed (e.g. traveling irrigator). |
|
Grade 3 Average quality |
Undisturbed natural profile; no less than 150 mm topsoil depth (may contain some stones) or constructed (cut/fill or reclaimed) profile with min. 150 mm average topsoil depth over subsoil; lateral pipe drainage system likely to be installed unless profile naturally free-draining; some signs of intermittent poor drainage in profile; surface may have been regraded; unlikely to be areas of localised subsidence but some minor undulations may be visible; some potential for extraneous water to be discharged onto the surface; unlikely to have irrigation system installed. |
|
Grade 4 Below average quality |
Built on old landfill/tip site; could also be cut/fill profile or reclaimed land profile; poor topsoil quality as evidenced by signs of compaction and/or poor drainage and structure; average topsoil depth likely to be less than 150 mm; subsoil mottling evident; likely to be some areas of localised subsidence or settlement; could also be undisturbed site with very shallow topsoil depth of poor quality; extraneous water likely to be discharging onto playing surface; no irrigation system installed. |
|
Grade 5 Low quality |
Built on old landfill/tip site; poor topsoil and subsoil quality as evidenced by signs of severe anaerobic conditions, compaction and poor structure; average topsoil depth may also be less than 100 mm; stones or other obstacles could be present in profile; areas of localised subsidence clearly visible; extraneous water clearly discharging onto playing surface; no irrigation system installed. |
Know your topsoil depth and quality:
A key feature of higher gradings is topsoil depth. In situations where a faster draining topsoil overlies a much slower-draining or even impermeable subsoil (a relatively common scenario), the depth of topsoil has a marked effect on surface performance in terms of draining the surface back to 'mechanical stability', an effect perhaps not well appreciated in the turf industry.
For example, consider a profile with 300 mm topsoil with a saturated hydraulic conductivity of 5 mm/hr over clay subsoil that drains at only 1 mm/hr. Assume that the soil contains 40% total soil porosity and is at a field capacity moisture content of 20% by volume prior to receiving rainfall (i.e. half of the total soil porosity if full of water and half is full of air). Ignoring for the moment any effect of surface slope or installed pipe drainage system, Table 3 shows the depth to which the topsoil would be saturated under four rainfall scenarios and more importantly, the time that would be taken to restore the top 50 mm of the profile back to mechanical stability (according to McIntyre , mechanical stability is required in the top 50 mm of a profile to significantly reduce the likelihood of surface damage).
Table 3: Illustration of the effect of topsoil depth on drainage performance of a soil-based sports field (adapted from McIntyre, 2004)
|
Topsoil depth |
Depth of profile saturated by rain (mm) |
Time taken to drain top 50 mm of profile (hours) |
||||||
|
10 mm rain |
20 mm rain |
30 mm rain |
50 mm rain |
10 mm rain |
20 mm rain |
30 mm rain |
50 mm rain |
|
|
75 mm |
50 |
75 |
75 |
75 |
30 hrs |
50 hrs |
50 hrs |
50 hrs |
|
150 mm |
50 |
100 |
150 |
150 |
10 hrs |
10 hrs |
50 hrs |
50 hrs |
|
200 mm |
50 |
100 |
150 |
200 |
10 hrs |
10 hrs |
10 hrs |
50 hrs |
|
300 mm |
50 |
100 |
150 |
250 |
10 hrs |
10 hrs |
10 hrs |
10 hrs |
Notes: Topsoil saturated hydraulic conductivity = 5 mm/hr; subsoil saturated hydraulic conductivity = 1 mm/hr.
Topsoil has gravitational water storage capacity of 20% by volume and is at field capacity before each rainfall event.
Shaded areas indicate where the entire topsoil depth is saturated after the rainfall event and drainage is only able to proceed through the profile at the subsoil rate of 1 mm/hr (assumes no surface run-off).
The implication from Table 3 is that not only do shallow depths of topsoil become quickly saturated by relatively small rainfall events, but also it takes a significant amount of time to restore the surface to mechanical stability. Therefore profiles with a shallow depth of topsoil will remain extremely vulnerable to surface damage for days when only small amounts of rainfall fall regularly over the winter period. If play takes place before this stability is restored, surface damage will be intense. Hence it is useful to have basic information on topsoil depth of individual soil-based sports fields in order to be able to help understand their field drainage and playing quality performance.
Linking field usage to soil properties:
Finally, any turf manager will be aware that all natural turf has an upper (biological) limit of use - exceed this limit and a field deteriorates to an unacceptable standard and costs of renovation become excessive. As the condition of a soil-based field can change very quickly, usage management in association with weather monitoring becomes central to all management practices.
Can sustainable field usage within a defined climatic region therefore be linked to the grading categories shown in Table 2 for all the cool and warm season turfgrasses used on sports fields in the upper North Island (e.g. poa/ryegrass, kikuyu, bermudagrass)? There is some indication from existing usage records of soil-based fields in the 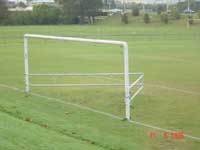
This means that being able to set guideline limits on use to prevent over-use and subsequent deterioration of the surface (i.e. allocating usage to match field condition) is not unreasonable, as opposed to applying a standard usage limit for all types of soil-based field regardless of quality.
Figure 3. A novel way of controlling casual use in high wear areas.
Conclusion:
Managing soil-based sports fields is a challenging business. Too often they are lumped under the one category and treated the same. In fact, variation in soil-based sports field performance is likely to be far greater than with more sophisticated sand-based fields. Knowing a little more about the profiles under such fields can help fine tune their management and help understand why they perform in a particular way.
Acknowledgements:
The author is particularly grateful to Auckland City Council and the Sports Field Forum NZ Inc. for supporting the work described in this article and to Peter Dury for providing the initial inspiration.
Sports Surface Design & Management, PO Box 33-127, Takapuna, Auckland, New Zealand (richardgibbs@ssdm.co.nz)

