Cricket Pitch Constitution Past and Present
It's over fourty years ago that Vic Stewart and I were allowed access to county grounds by the MCC to find out what we could about the constitution of county pitches and the factors that determine playing character. Unknowingly we had pushed at an open door because in 1962 the Advisory County Cricket Committee had set up a sub-committee 'to look into ways and means of producing pitches which are faster in pace and do not help one type of bowler'. The committee included Bert Lock of the Oval and Bernard Flack, head groundsman at Edgbaston, both of whom served later as county pitches inspectors. The committee reported in 1963 and we approached the MCC early in 1966.
 We managed to visit and sample eleven grounds in 1966, including four test grounds. Our measurements at the end of play were limited but included penetration resistance and ball rebound from four drop heights (4, 8, 12 and 16ft). We interviewed groundsmen and players to get opinions on pitch characteristics and it was easy in those days to arrange to talk to top international players.
Our first report was in February 1967 and by that time we had developed the ASSB (motty) test and shown relationships between measured ball bounce and soil strength. Also we had shown that soil binding strength depended upon particle size distribution and organic matter content.
By the end of 1967 we had accumulated a great deal of knowledge that was of practical value to groundsmen so we offered to provide courses for county groundsmen at the University. The courses, which were supported initially by the MCC and subsequently by the TCCB, were held early in January from 1968 to the early 1980s with a few gaps.
An important component of these courses, that were held over four of five days, was the 'hands on' experience made possible through access to laboratory facilities. In order to make best use of the opportunity, sampling tins were sent out to all intending attendees to collect representative 2cm deep sections of square and outfield.
One may question the reliability of sampling and possibly analyses (although we carried out some of the more difficult analyses like particle size distribution), but these courses provide the most comprehensive information on the constitution of county cricket squares over that period.
It is also true that the courses were important social events remembered fondly by those who attended. In order to identify some of the changes that have occurred on county cricket squares I have summarised information from two sources. One is the groundsmen's courses at Aberystwyth (1968 - 1980) and the other is the county pitches coring programme from 1997 to 2001 funded by the ECB and carried out jointly by the Soil Science Unit at Aberystwyth and the STRI where Stephen Baker collated and analysed the data. For consistency in the data I have focussed on sixteen county grounds: Derby, Chelmsford, Sophia Gardens, Bristol, Canterbury, Old Trafford, Leicester, Lords, Northampton, Trent Bridge, Taunton, The Oval, Hove, Edgbaston, Worcester and Headingley.
| % Clay content of 16 county squares (0 -20mm) | ||
| 1968/69 | 1997/2001 | |
| Mean | 31.6 | 29.0 |
| Range | 22 -41 | 27 - 32 |
| Grounds more than 32% | 7 | 0 |
| Grounds less than 27% | 3 | 0 |
Mean clay contents have decreased slightly on top grounds since the late 1960s but the key difference in the data is that nowadays clay contents are far more consistent. The range from highest to lowest in the late 1960s was 19% whereas from the recent records it is only 5%. Linked to this is changes in the clay content of loam topdressing. Topdressings used on county squares in the late 60s and early 70s ranged from less than 20% clay to over 40%. Not only this but it was not uncommon for loams from any given supplier to change dramatically from one year to the next.
| Grasses on sampled sections of 16 county squares | |||||
| No. of grounds recorded as being present | No. of grounds wheredominant or co-dominant | ||||
| Species | 1969/72 | 1980 | 1969/72 | 1980 | |
| Poa annua | 16 | 12 | 12 | 0 | |
| Agrostis capillaris | 12 | 16 | 8 | 4 | |
| Festuca rubra | 8 | 3 | 0 | 0 | |
| Lolium perenne | 0 | 15 | 0 | 2 | |
| Poa trivialis | 2 | 0 | 0 |
0 |
|
| Cynosurus cristatus | 1 | 0 | 0 | 0 | |
The results from 1968 and 1972 were similar so means were taken. The sub-committee mentioned earlier recommended a seeds mixture of 60% Chewing's fescue, 20% New Zealand browntop bent and 20% Crested dogstail. Seed suppliers sold mixtures similar to this for cricket and groundsmen generally used them. I have included systematic names for species in the table that is not strictly justified because the precise species were not identified.
 The years between 1970 and 1980 saw the beginning of a marked change in the grasses on cricket squares. Although the table reports no perennial ryegrass on the squares included in the analysis it was present on two or three squares at other grounds from which groundsmen attended. The use of fine turfgrasses on cricket squares led to two difficulties. Firstly bent and fescue tend to be mat formers, which increases maintenance problems and secondly they are not very competitive against annual meadowgrass which was dominant on many squares.
It was clear by the early 1970s that perennial ryegrass with its vigour, wear tolerance and strong rooting was much better suited to the requirements cricket but the available cultivars were too vigorous, stemmy and open tillering. The most suitable cultivar at the time was 'S23' but it was not long before cultivars with better turfgrass characteristics from the USA and continental Europe became available.
The data show the increasing presence of perennial ryegrass on county squares so that by 1980 it was evident on fifteen of the sixteen squares included in the study and was dominant or co-dominant on two. Since 1980 the situation has progressed to that where cultivars of perennial ryegrass are the only ones sown on most squares.
|
% Organic matter in the 0-20mm depth of 16 county squares |
||
| 1968/69 | 1997/2001 | |
| Mean | 11.2 | 9.4 |
| Range in % | 7.9 - 13.5 | 6.3 - 13.0 |
| No. of grounds less than 10% | 4 | 10 |
| No. of grounds greater than 12% | 5 | 1 |
The difference in mean organic matter content of 1.8% does not appear to be very large. However it is worth noting that the two means fall either side of the 10% organic matter content often advised as the target maximum for squares on the basis of past practical experience and on technical grounds. In fact at the end of the 90s ten of the sixteen grounds had organic matter contents less than 10% whereas only one quarter of the grounds fell in this category in the late 60s. The clay contents of pitches showed a marked decrease in range over the period but the absolute range in % organic matter contents seems not to have decreased despite the mean value having decreased.
 The tendency for organic matter to accumulate and cause a thatchy surface has always been a turf management issue but particularly when it became possible to eliminate casting earthworms. Earthworms have been controlled on most grounds since the middle of the last century by using a range of vermicides in order to avoid the problem of dealing with worm casts.
It is fair to conclude therefore that the change in mean organic matter content evident in the table is not due to a difference in natural mechanisms affecting control of organic matter at the surface. Since the 1960s there have been major advances in the effectiveness of machinery designed to remove excess organic matter at and close to the surface. It is likely that the key reason for the decrease in mean organic matter content of squares is due to the availability and use of more effective equipment.
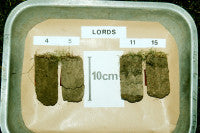
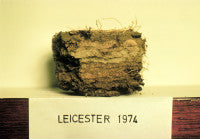
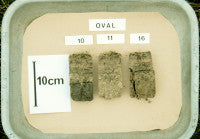
Whilst controlling organic matter to around 10% in the top 20mm may have a direct effect on pitch performance I believe the key issue is that the work to achieve this ensures elimination of thatch at the surface. This in itself makes it possible to integrate topdressings with the existing mineral soil surface. Failure to achieve this is the main cause of discontinuities in pitches affecting binding with depth and resulting in low, uneven bounce. The practical test is that county squares should be less layered now than they were in the past. I am confident that this is the case and believe that the photographs of pitch sections illustrate the point.
Sections of squares sampled for our 1969 course included several with organic staining and roots visible between topdressings. The sections, with pitch numbers, were sampled from the Lords and Oval squares in 1996. It is not possible to see any distinct layering in the top 20mm of any pitch. I have tried to be unbiased in selecting the photographs used. Nevertheless layering and the occurrence of discontinuities in pitches are problems that have not gone away. It is just that, at least at the top level, knowledge and skills in maintenance have gained an upper hand.
