Hollow Coring
Introduction: Why model core aeration and topdressing?
It seems that thatchy greens are a perennial problem at a significant number of clubs. This may come as no surprise when often many greens are managed as if thatch were not a problem at all with limited hollow coring and/or scarification regimes employed. While many greenkeepers have the desire to improve the situation, their respective committees often prevent them from carrying out the necessary work.
Whether hollow coring (Photograph 1) or deep scarifying, this reluctance is largely due to the fact that thatch removal is an invasive operation, and golfers generally fail to see

Photograph 1: Hollow coring greens is a disruptive operation.
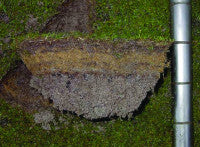
When a thatch problem such as that seen in Photograph 2 is identified, an array of questions arises. How do we rectify the problem? What will correction of the problem entail and how long will it take? We know that hollow coring and/or (deep) scarification coupled with top dressing is the remedy. Just how much top dressing is required and timescales for the work are more difficult questions to answer.
In this article the application of mathematical models currently available are appraised. Three models that allow us to calculate appropriate tine sizes and amount of top dressing required are reviewed. It will become apparent that it may even be possible to set definitive targets and put a timescale on thatch removal programmes.
The models currently available
There are three models all of which are currently available online for use at their respective websites. The first two models are of practical use as they stand, in that they are essentially simple calculators of area impacted through hollow coring, then the amount of top dressing required after coring. Both models calculate using tine dimensions decided by the user. The third model, whilst perhaps being the most promising, is at present still in its developmental stage.
Look at
Greenfactory Productions Online tine tool:
http://www.greenfactory.co.uk/tools/tinetool/index.aspx
Online Wedge Hollow Tine Simulator:
http//www.wedge-bv.com/english/wedge_handelsmaatschappij.html
The 'Greenfactory Productions Online tine tool' and 'Online Wedge Hollow Tine Simulator' allow the user to calculate the area impacted by various coring operations. Area impacted when hollow coring has been documented by Baker (1983) and Hartwiger & O'Brien (2001). These online models take the works of Baker (1983) and Hartwiger & O'Brien (2001) a step further, enabling the user to quickly calculate surface area impacted by various tine diameter, spacing and penetration depths. Based on a predetermined target surface area, both calculators will also output the number of operations required to satisfy that target.
In the example shown below (Figure 1) the Online Wedge Hollow Tine Simulator model has been asked to calculate the area impacted using standard ½ in. (12 mm) diameter tines, arranged at 2 in. (50 mm) centres and penetrating to a depth of 3 in. (75 mm). The area to be worked (i.e. 5625 ft2 ? 500 m2) has been selected as that of a single green. A target area of 20% (annually) has been input. This target is based on what a USGA Green Section report requires for a core aeration programme to be successful on mature greens (Hartwiger & O'Brien 2001). Hartwiger & O'Brien (2001) acknowledge that this figure of 20% impacted area is based on experience and not experimental data. In certain circumstances, where thatch levels are very high for example, a greater surface area may need to be impacted to achieve the desired effect. The impacted area is thus dependent on your circumstances and adjusted accordingly.
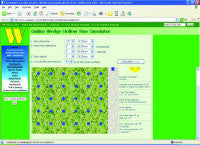
After calculation, the output tells us that with the tine specification detailed, 4.91% of surface area will be impacted by a single operation (Figure 1). Perhaps more importantly is the fact that more than 4 coring operations will be necessary to achieve the target of 20%. Indeed, the model is a little over simplistic in this regard as it makes no account for overlap of core tines in subsequent operations.
The Greenfactory Productions website can also be used to calculate the area impacted when scarifying as opposed to hollow coring. For this, visit the website http://www.greenfactory.co.uk/tools/TineTool/scari.aspx.
Online Top Dressing Calculator:
http://aggie-turf.tamu.edu/aggieturf2/calculators/topdress-sheet.html
More often than not, having opened up the soil profile through coring, one wants to replace the removed material with fresh top dressing to dilute thatch, restore surface levels and firmness, improve drainage and/or generally improve the overall quality of the rootzone. This model enables the amount of top dressing required after a specific coring operation to be calculated. As with the tine simulator above, this model requires the input of the tine diameter, depth and spacing, the latter needing to be input as the number of cores per unit area (i.e. cores ft-2), which are documented by Hartwiger & O'Brien (2001). In addition, the total area to be top-dressed and depth of top dressing required on the surface are also required as additional parameters for the model to calculate.
Usefully there are three outputs from this calculator: (i) the amount of topdressing required if the surface were not hollow cored, (ii) the amount of top dressing needed to fill the specified hollow core holes and (iii) the amount of top dressing required to fill the hollow core holes and satisfy the amount of top dressing required on the surface. One criticism of the model might be that it appears to assume that all the top dressing applied will fully integrate into the tine holes. In practice, of course, the integration of sandy dressing is often problematic.
In another example below (Figure 2), the previous calculation made in hollow tine simulation is followed through. The amount of top dressing required is calculated for ½ in. diameter tines arranged at 2 in. centres and to a depth of 3 in. From these parameters the model has calculated that 9 ft3, 69 ft3 and 78 ft3 is needed to apply 0.02 in. (0.5 mm) of top dressing to the un-cored surface, to fill the holes, and to fill the holes and provide 0.02 in. of top dressing respectively. Assuming that the bulk density of sand is typically 1.75 tonnes m-3 (Baker 1990), these amounts equate to approx

Figure 2: Input and output gained from the Aggie-turf Online Top Dressing Calculator Modified from http://www.aggie-turf.tamu.edu/aggieturf2/calculators/topdress-sheet.html.
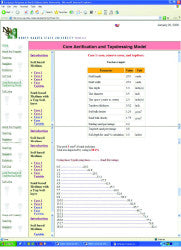
Core Aerification And Topdressing Model:
http://www.ag.ndsu.nodak.edu/plantsci/turf/main.htm
This Core Aerification and Topdressing model is a computer simulation that evaluates the effectiveness of hollow coring and top dressing (Li et al. 2002). It is valuable in that you can model several scenarios and set certain targets you wish to attain. Examples of possible scenarios that might be modelled are a soil exchange programme, removal of thatch or an imported sod base after turfing. The model can also be run for soil and sand based greens. A selection of coring and top dressing programmes can be selected. These regimes include hollow coring, removing cores and top dressing; hollow coring breaking down cores and top dressing; hollow coring with no top dressing and top dressing alone.
Modelled calculations require more detailed input parameters. As well as the hollow tine dimensions (i.e. diameter, depth of penetration and spacing), the model also requires bulk density of indigenous soil, the amount of top dressing sand in indigenous soil as well as a target for the amount of sand within a predetermined depth of soil. If the model were to be used out in the field, then the existing soil and top dressing material would need analysing for bulk density and sand content in order to devise a suitable coring and top dressing programme. Figure 3 shows the inputs needed to work the model.
In the example (Figure 3) a scenario has been set up where the aim is to carry out a soil exchange programme. The objective is to improve the sand content of a soil based rootzone to 4 in. (100 mm). Bulk densities have been assumed to be that of a typical clay soil (Brady 1990) and sand (Baker 1990). The existing soil is said to contain 20% (w/w) sand and a target of 80% (w/w) sand is set. Tine dimensions have been set as standard ½ in. (12 mm) diameter arranged at 2 in. (50 mm) centres and penetrating to a depth of 3 in. (75 mm). With these parameters input, the model calculates that a green of 25 by 25 yards (i.e. 5625 ft2 ? 500 m2) will need to be cored 18 times and require 3 yd3 of top dressing after each coring treatment. In addition, by the end of the programme 88% of the surface area will have impacted.
Again assuming a typical bulk density of top dressing sand is 1.75 tonnes m-3, the volume of sand needed after each coring treatment can be estimated in kg m-2. The models estimate of 3 yd3 equates to approximately 8 kg m-2. This figure initially appears high, but the model calculates that a minimum of 0.02 in. (0.5 mm) layer of sand is laid down across the whole surface as well as filling the holes. However, returning to the Online Top Dressing calculator above, it was calculated that 6 kg m-2 was needed to fill the holes alone, this figure being more in line with standard recommendation. Data for deep scarification would also be a useful additional parameter for the model.
While having great potential for devising suitable hollow coring programmes, this model cannot as yet be used out in the field due to the lack of empirical data. Field experimentation is necessary to fully validate the model and ensure the coring programmes it devises are sensible. Sensitivity analyses are also required to identify the most important parameters affecting the model. The model appears to be sensible for the inputs it is generating. For example, it correctly decreases the number of hollow coring operations required with increasing tine size and/or a decrease in tine spacing arrangement. However, there is lack of flexibility in that at present it assumes that there is no overlap between coring operations. Also a programme encompassing the use of different sized tines at different times of the year cannot be determined at present. It should also be noted that this model can only be used to estimate the removal of existing material, no account is made for increasing organic matter as a consequence of ongoing growth. Removal of sod base could also be contentious as no account is made for depth of sand applied and building on top of a sod layer.
Conclusion
The Online Wedge Hollow Tine Simulator and the Online Topdressing Calculator may appear a little simple, but what they do achieve is offer the ability to make more informed decisions when formulating hollow coring regimes. By calculating the area of turf affected by certain coring operations, it becomes apparent how little material we might be removing on an annual basis. This may, in certain circumstances, explain why thatch problems remain. It is often the case that despite top dressing after coring, the holes remain visible and render the surface uneven. Visibility of the holes may be influenced by accelerated growth of turf over the holes as well as the holes not being completely filled with top dressing. The top dressing calculator indicates that we might be under-applying top dressing after coring, thus compromising aesthetics and smoothness of playing surfaces.
While these models go some way to answering the questions of how we rectify a soil profile problem, what that will entail and how long it will take, the model with the greatest potential is the Core Aerification and Topdressing Model. This model enables the user to run several scenarios before deciding upon the most suitable coring and top dressing programme. Timescales for different hollow tine set-ups can be evaluated against predetermined targets derived from soil analyses and a suitable hollow coring and top dressing programme decided upon. The failing of this model at present is a lack of empirical field data needed to evaluate how sensible its outputs are.
References
Baker (1983). Technical note - Rates of soil replacement by a combined hollow tining and top dressing programme. Journal of the Sports Turf Research Institute, 59, 146-147.
Baker, S.W. (1990). Sands For Sports Turf Construction and Maintenance. STRI Bingley, West Yorkshire, UK.
Brady, N.C. (1990). The Nature and Properties of Soils (Tenth Edition). Macmillan Publishing Company, New York.
Gray, J.L. Determine your topdressing volume need with or without core aerification http://www.aggie-turf.tamu.edu/aggieturf2/calculators/topdress-sheet.html.
Hartwiger, C. & O'Brien, P. (2001). Core aeration by numbers. USGA Green Section Record 39 (4), 8-9.
Li, D., Minner, D.D. & Christians, N E. (2004). Evaluation of core aerification and/or topdressing by computer simulation. Acta Hort 661, 323- 332.
Li, D., Minner, D.D. & Christians, N.E. (2004). Evaluation of core aerification and/or topdressing by computer simulation. http://www.ag.ndsu.nodak.edu/plantsci/turf/main.htm.
Online Wedge Hollow Tine Simulator.
http://www.wedge-bv.com/english/wedge handelsmaatschappij.html.